

2 Nov 2026
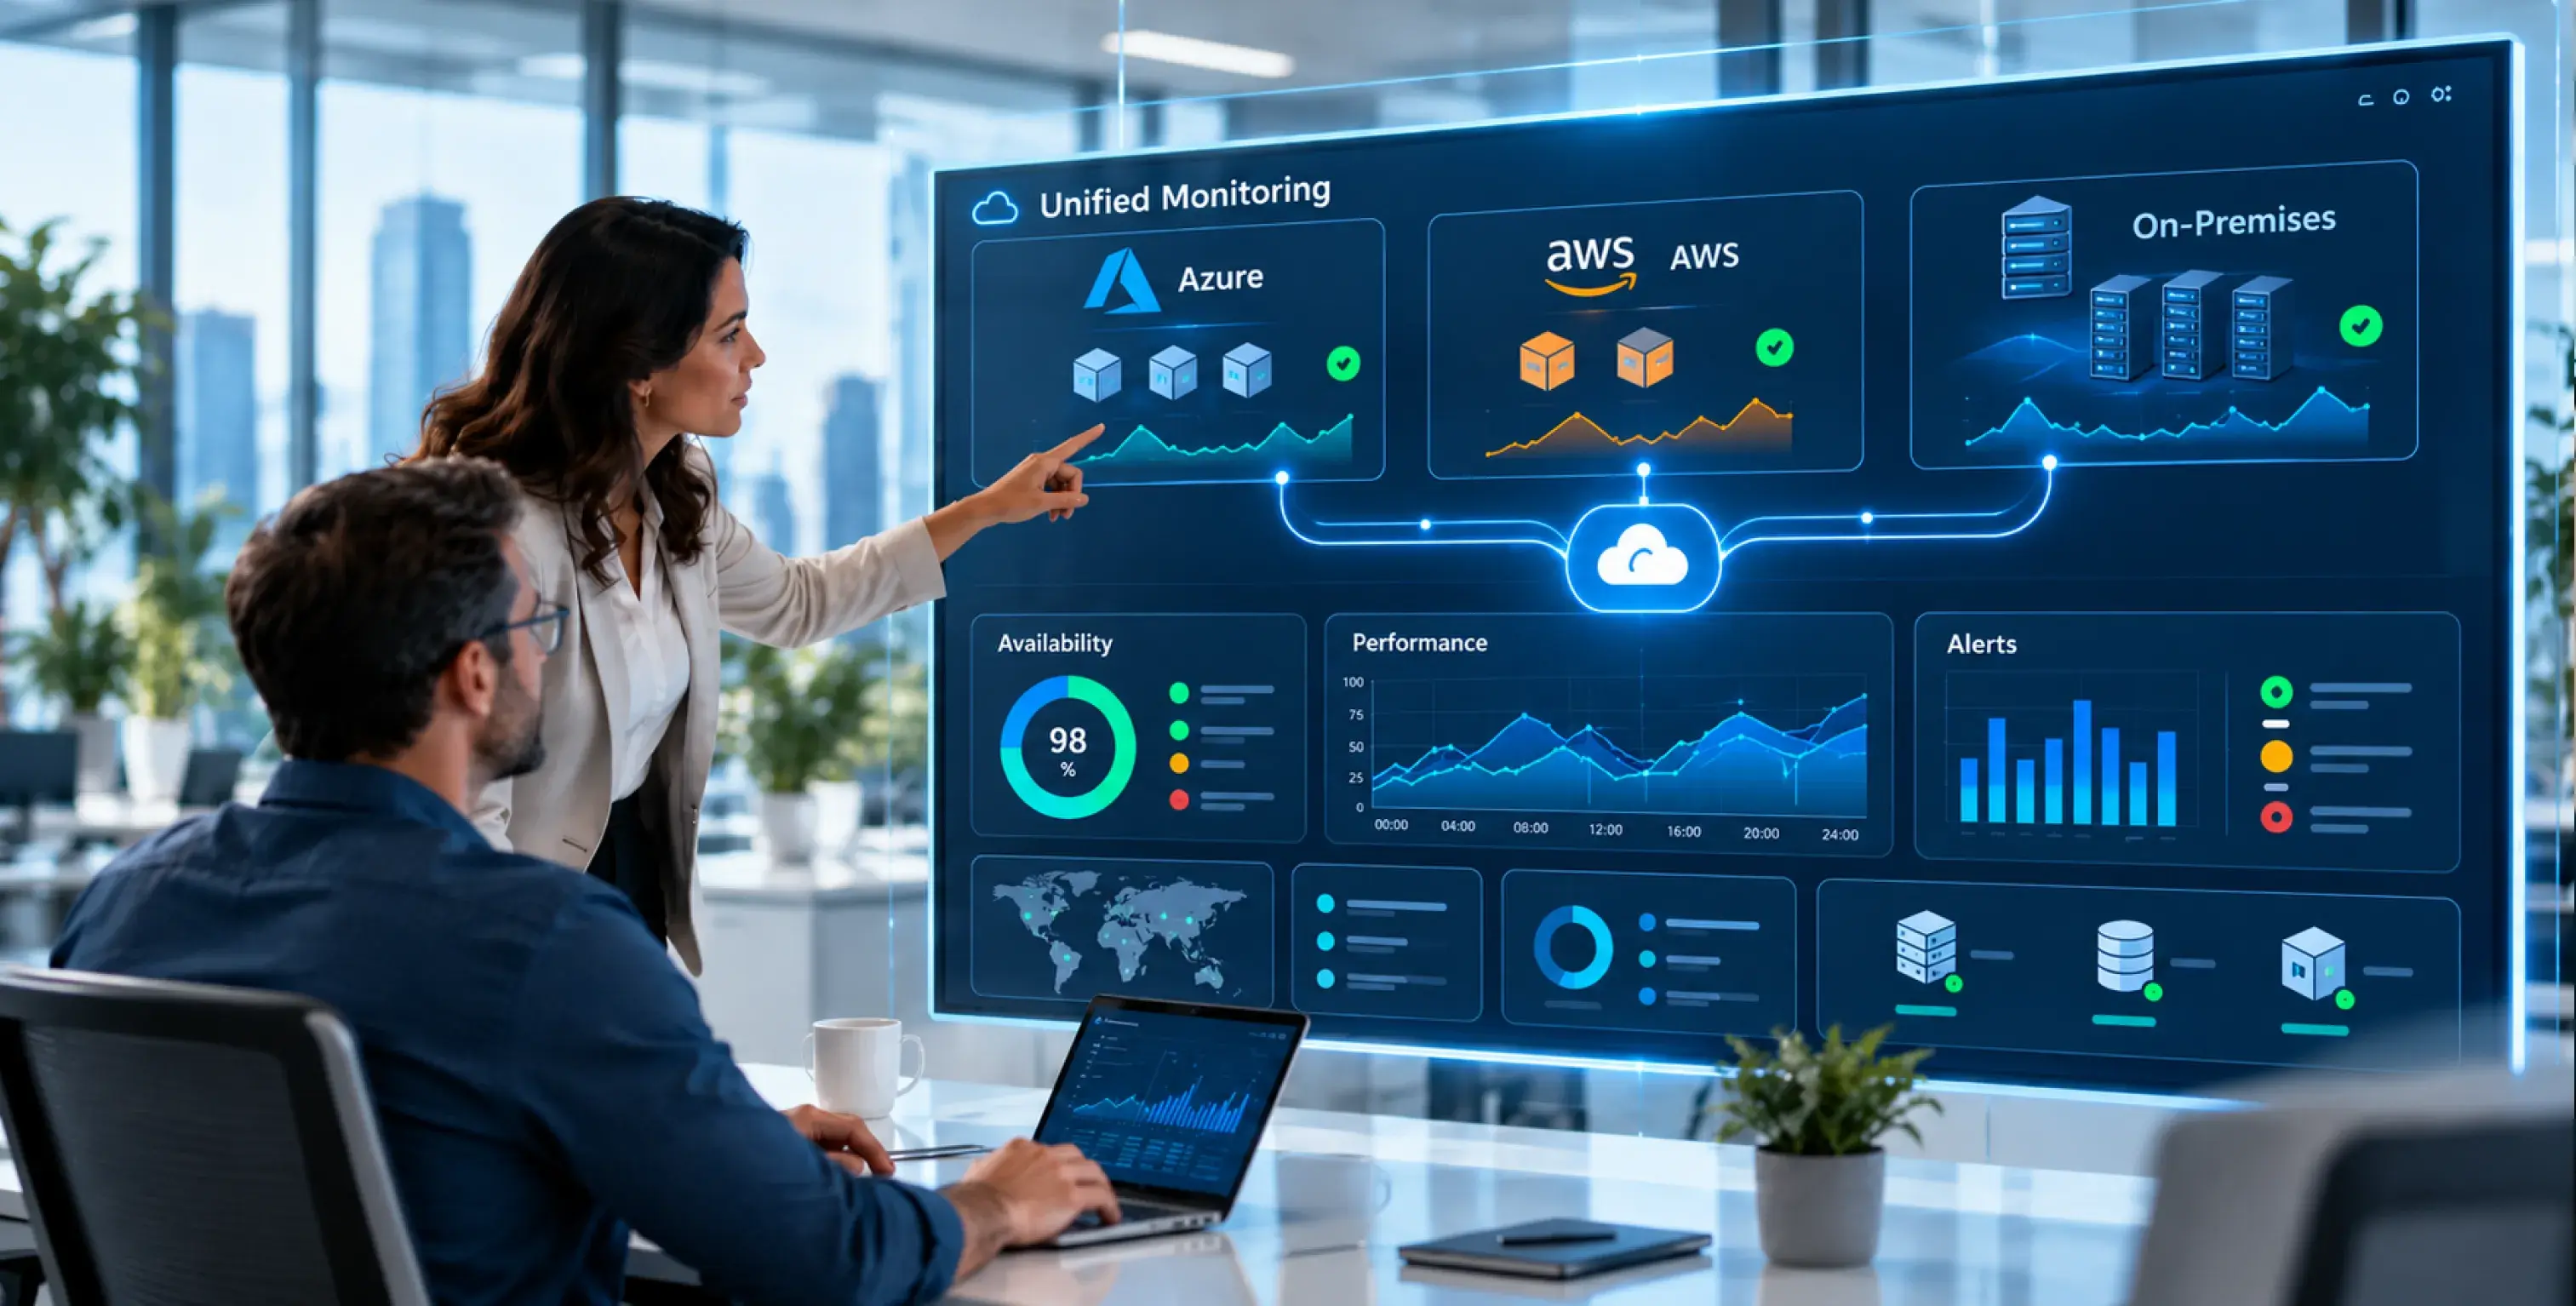
Consider an illustrative incident: at 2:47 a.m., an on-premises storage array starts reporting high latency. By 2:53, dependent database replicas in AWS show increasing lag. By 3:10, an Azure-hosted customer API returns errors and finally triggers the on-call page. Three environments, three monitoring consoles, three symptoms of one incident, and the engineer spends much of the incident assembling the dependency timeline across separate consoles.
Unified infrastructure monitoring means collecting health, performance, and log telemetry from Azure, AWS, and on-premises systems into a single correlated view, so incidents appear as one story instead of three disconnected symptoms. Nobody chooses the fragmented alternative; it’s simply the default, because Azure ships Azure Monitor, AWS ships CloudWatch, and your server room came with its own tools, each excellent inside its borders and blind past them. At Calance, we plan hybrid monitoring around these cross-environment dependencies, not isolated dashboards. This article walks through why it keeps happening, what the native tools genuinely can and cannot do as of late 2026, the four ways to build one view, and what the first ninety days of actually building it look like.
TL;DR
Incidents Cross Cloud Boundaries
Failures travel across environments; telemetry doesn’t. A fault born on-premises surfaces as an AWS symptom and pages from Azure, and engineers reconstruct the chain by hand across consoles and query languages while the clock runs at outage prices.
Native Tools Need Cross-Cloud Configuration
Azure Monitor can collect from other clouds using Arc, supported connectors and custom ingestion. CloudWatch can receive external telemetry through agents and integrations. Neither automatically provides complete service dependencies, shared ownership or incident correlation without configuration.
One View Is Built in Layers, Then Watched
Standardized collection (increasingly OpenTelemetry), one correlation layer, audience-specific dashboards, an alert policy with owners, and a human awake to respond. We map four architectural routes to that outcome and a realistic 90-day path through the work.
Anatomy of the 2:47 a.m. Incident
Follow this example across three consoles to see how a single dependency failure can appear as unrelated incidents.
In the server room, the SNMP-based tool watching the storage array did its job: it logged a latency threshold breach at 2:47. The alert went to an email folder reviewed in the morning because years of false positives had trained the team to mute that tool at night.
In AWS, CloudWatch saw replica lag climbing on the database tier at 2:53 and raised an alarm at its configured threshold, which was set loose, because transient lag happened often enough that tighter settings were noisy. The alarm auto-resolved twice as lag oscillated. No page.
In Azure, Application Insights saw the API error rate cross 5 percent at 3:10 and paged. The engineer who answered saw an Azure problem, spent twenty minutes ruling out Azure causes, then opened the AWS console, found the lag, and spent another half hour before anyone thought to check the storage array that had been screaming since 2:47.
In this hypothetical example, the first signal appears promptly, but diagnosis is delayed because dependencies and alerts are not correlated. With the Uptime Institute reporting that 57 percent of major outages now cost over $100,000 and one in five exceed $1 million, the delay before diagnosis can materially increase business impact. This scenario illustrates a common operational pattern, but its timestamps are not drawn from a documented Calance customer incident. Organizations should measure their own time to detect, diagnose, and restore before estimating savings.
Why Does Each Console Only See a Third?
Azure, AWS, and on-premises infrastructure each have their own monitoring tools, but those tools don't automatically share what they detect. Azure Monitor, Amazon CloudWatch, and traditional on-premises monitoring systems collect different types of information, making it difficult for IT teams to connect related issues across environments. Understanding what each tool can see, and where its visibility ends explains why a single infrastructure problem can trigger multiple alerts without revealing the underlying cause.
What Azure Monitor and Azure Arc can monitor
Azure Monitor is Microsoft’s unified observability service: metrics, logs, and traces flowing into Log Analytics workspaces, queried with KQL. Its built-in integrations are strongest for Azure resources. Its reach beyond comes from Azure Arc, which projects outside machines into Azure as managed resources. Install the Arc agent on an on-premises server or an AWS EC2 instance, and it can run the Azure Monitor Agent, land telemetry in the same workspace as your Azure VMs, and participate in the same alert rules. Microsoft also documents multicloud monitoring with Azure Monitor, including approaches for AWS and Google Cloud telemetry. Arc’s multicloud connector can inventory supported AWS resources, but inventory alone is not full service monitoring.
So the Azure-centered view is real, with two caveats that matter at 2:47 a.m. First, Arc-enabled server telemetry does not automatically provide full AWS platform-service monitoring. AWS service metrics, logs, and traces need supported connectors, exports, or custom collection, with coverage verified per service. Second, ingestion, retention, cross-cloud data transfer, and query costs vary by telemetry source and configuration. Model them against the planned data volume and retention policy rather than relying on a single platform-wide storage period.
What Cloud Watch can really do
Amazon CloudWatch is the AWS-native stack: auto-published metrics for every AWS service, CloudWatch Logs, alarms, dashboards, and cross-account observability across an organization. Its hybrid reach runs through the CloudWatch agent, which installs on on-premises servers and ships their metrics and logs in like any EC2 host. AWS has also gone decisively open-standard: the X-Ray SDK entered maintenance mode in February 2026 with OpenTelemetry (via the AWS Distro, ADOT) as the recommended instrumentation path, and June 2026 brought native OTLP metric ingestion into CloudWatch, queryable with PromQL.
The asymmetry is the catch: there is no Arc equivalent pointing at Azure. CloudWatch does not automatically ingest native Azure platform telemetry. Azure metrics and logs can be integrated through custom exporters, collectors, or partner integrations, but the coverage and maintenance burden need explicit design. Add per-metric, per-dashboard, and per-GB pricing that compounds at hybrid scale, and CloudWatch-outward is a strategy with a hard ceiling.
What must still be configured across platforms
Neither product automatically understands your complete cross-cloud dependency graph without appropriate collection, common metadata, and configured analytics. The storage array, the replica lag, and the API errors were three symptoms of one dependency failure, and it is unlikely that an unconfigured dashboard would explain the chain, partly because they don’t share data and partly because they don’t even share a language: Azure speaks KQL, CloudWatch Logs Insights speaks its own syntax, and the on-prem tool speaks SNMP trap. Correlation, the thing that converts detection into understanding, is precisely the layer you have to build or buy.
One vocabulary note before the options, because it shapes what you’re buying. Monitoring checks known indicators against thresholds and answers, "Is it up?” Observability combines metrics, logs, and traces so you can investigate problems you never predicted, answering "Why is it slow?” In the example, individual components have monitors, but there is no useful shared incident context: every threshold fired correctly, and nobody could see the story. For a hybrid estate you want monitoring as the floor everywhere and observability on the systems where slow equals emergency.
And a warning about the phrase you’ll hear most in this market: single pane of glass. The term over-promises because it describes a product when the real thing is an outcome assembled from standardized telemetry, one correlation layer, owned dashboards, and alert policy. Buy the pane without doing that assembly, and you’ve purchased console number four.
Four Ways to Build the One View
| Criterion | Extend Azure Monitor + Arc | Extend CloudWatch outward | Vendor-neutral observability stack | Managed monitoring / NOC service |
|---|---|---|---|---|
| Coverage breadth | Azure deep; other clouds via Arc, connectors and ingestion | AWS deep; other systems via configured ingestion | Anything you instrument: servers, containers, network, apps, all clouds | Everything contracted, including network gear and legacy systems |
| Metrics / logs / traces | All three, KQL-centric | All three, OTel-forward since 2026 | All three by design (OpenTelemetry native) | All three, delivered as outcomes |
| Cross-environment correlation | Possible with effort inside Log Analytics | Requires integration and correlation design | As good as you engineer it | Built in, plus human triage |
| Skills required | Strong Azure/KQL | Strong AWS | Deepest: collectors, storage, query, dashboards as a product | Minimal in-house; governance only |
| Cost shape | Ingestion + egress per GB | Per-metric/per-GB, grows with cardinality | Infrastructure plus permanent engineering time | Predictable monthly fee |
| Who answers at 2:47 a.m. | Your on-call | Your on-call | Your on-call | Their NOC, by contract |
Route one, Azure Monitor plus Arc, is the pragmatic answer when Azure is your center of gravity and AWS is a minority footprint: one query language, one alerting engine, and native ties to Azure governance, security, and policy. It pairs naturally with estates we already operate under Azure managed services, and for shops midway through an Azure idation consolidation, it means the monitoring investment compounds with the platform investment. Verify AWS-service collection coverage and model ingestion costs at your real log volume before committing.
Route two, CloudWatch outward, fits the mirror image: AWS-first with a server room and little or no Azure. The agent handles on-prem hosts, cross-account observability handles sprawl, and the 2026 OTLP support means instrumentation you write today stays portable. If Azure is significant, estimate the effort of feeding Azure telemetry into the chosen collection and analysis layer before committing.
Route three, a vendor-neutral stack, builds on OpenTelemetry, the CNCF standard for collecting metrics, logs, and traces once and exporting them anywhere; both Azure Monitor and CloudWatch accept OTel data, and the CNCF has documented this exact pattern unifying AWS, Azure, GCP, and on-prem. This is the most complete answer for true multi-cloud at scale and the most demanding: collectors, storage, retention, dashboards, and upgrades become a product your team owns permanently, which is a funding decision disguised as a tooling decision. Choose it with platform engineers on payroll, or don’t choose it.
Route four, a managed monitoring and NOC service, buys monitoring operations and response coverage: unified collection across all three environments, correlation, audience dashboards, and trained humans acknowledging and acting around the clock. It can provide a contracted human response when supported by adequate telemetry and an agreed escalation process, which is why it wins whenever the real gap is coverage hours rather than software, and why regulated clients often land here too: the monthly evidence pack doubles as audit material. This is the operating model behind our IT infrastructure and operations services, run with the same watch-floor discipline we described in our security operations center explainer.
How do you pick? Three questions settle most cases faster than any feature matrix. Where will your estate’s center of gravity be in three years, not today, because the pane should match the destination, and mid-migration teams should standardize collection first (agents and OTel) so telemetry survives every wave, then pick the pane when the mix stabilizes. Second, what does your log volume cost in each model, counting ingestion, retention tiers, cross-cloud egress, and metric cardinality, reviewed with the same rigor we apply to cloud spend in our FinOps on Azure guide. Third, finally, who is awake? Continuous in-house coverage requires staffing for multiple shifts, leave, escalation and specialist skills, and if that math doesn’t work, routes one through three all quietly depend on a night shift you don’t have, which is the case for route four or a split model like our co-managed IT services, where your team keeps the architecture and a partner keeps the nights.
Ninety Days to One View: What the Build Actually Looks Like
Building a unified monitoring system across Azure, AWS, and on-premises infrastructure takes more than connecting a few dashboards. IT teams need to identify existing visibility gaps, establish consistent data collection, connect alerts across environments, and assign clear response responsibilities. The following 90-day plan breaks the process into manageable phases, from initial discovery to a working monitoring system that helps teams detect and resolve issues faster.
Weeks 1 and 2 are about finding out what you own. Automated discovery runs across Azure subscriptions, AWS accounts, and on-prem networks, reconciled against finance records, and the output is always humbling: the delta between servers-that-exist and servers-being-watched is your blind-spot count, stated as a number executives understand. The same fortnight produces the tier map (which systems are business-critical, which are heartbeat-only) and the golden signals per tier: latency, traffic, errors, and saturation for services; up/down, capacity, and performance for infrastructure. Projects that skip tiering die later of cost and noise, because monitoring everything at equal depth guarantees both.
Weeks 3 and 4 are for wire-up collection, per environment and without ideology. Azure platform telemetry flows natively; AWS platform telemetry flows from CloudWatch; OS-level depth comes from agents (Arc and the Azure Monitor Agent, the CloudWatch agent, or OTel collectors, depending on your route); network devices, storage arrays, and appliances come in agentless over SNMP and APIs, because the physical layer has failure modes clouds abstract away and it is exactly where the 2:47 incident was born. Anything you instrument yourself gets OpenTelemetry, so the data outlives this year’s tool decision. Two rules here prevent later grief: tag at ingestion (environment, service, owner, tier), since correlation is only as good as metadata, and monitor the collection itself, because a silently failed agent is silent blindness.
Weeks 5 through 8 centralize and make it legible. Telemetry routes into whichever correlation layer you chose, and dashboards get built per audience rather than per tool: one executive view (service health, uptime against SLA, incidents this month), one per service owner showing their stack end to end across all three environments, and engineering views for diagnosis. Every dashboard gets a named owner and a review date; the unowned ones are deleted, because dashboard sprawl is just tool sprawl wearing a nicer theme. This is also when the cross-environment checks that belong to nobody’s native tooling finally get owners: synthetic tests on the VPN tunnels, ExpressRoute circuits, and replication paths between environments, the connective tissue where root causes hide.
Weeks 9 and 10 turn alerts into policy. Every signal that pages a human must carry a severity, an owner, and a runbook link; thresholds derive from the tier map, not tool defaults; everything else becomes a dashboard line. Correlation rules compress the storm: deduplicate identical signals, group by service and time window so one outage is one incident, and suppress downstream symptoms when the upstream cause is already paging. This is where AIOps earns a place, as anomaly detection that learns each metric’s normal and clustering that turns fifty symptoms into one probable cause, and where it doesn’t: machine learning on badly tagged, half-covered telemetry just produces confident nonsense faster. One practical review trigger: if a high share of pages ends in “no action taken,” review severity, routing, deduplication and runbooks, and the mute-the-noisy-tool reflex that buried the storage alert at 2:47 starts growing back.
Weeks 11 and 12 connect detection to response. On-call schedules, acknowledgment targets, and escalation chains go live, and every incident creates an owned ticket in your ITSM platform rather than an email, the same alert-to-ticket discipline that underpins our IT help desk services. The security overlap gets formalized too: infrastructure logs feed the security stack, unusual resource consumption gets treated as a possible breach signal, findings from vulnerability assessments map onto the same asset inventory, and the threat-detection watch, whether internal or through managed detection and response, shares one source of truth with the health watch about what exists.
From day 90 onward, the practice is maintenance plus measurement. Monthly: the ten noisiest alerts fixed or retired, coverage reconciliation rerun, ingestion costs reviewed by source, and thresholds tuned from postmortems. The handful of numbers worth reporting to leadership: coverage (enrolled versus discovered, target 100 percent), MTTD and MTTR trending down, actionable page rate set from a measured baseline, uptime per tier-1 service against SLA, and the bluntest truth-teller we track, detection source: what share of incidents did monitoring find before a user did? Set an agreed target based on incident types and business impact, and review exceptions monthly.
How Do You Verify That the Unified View Works?
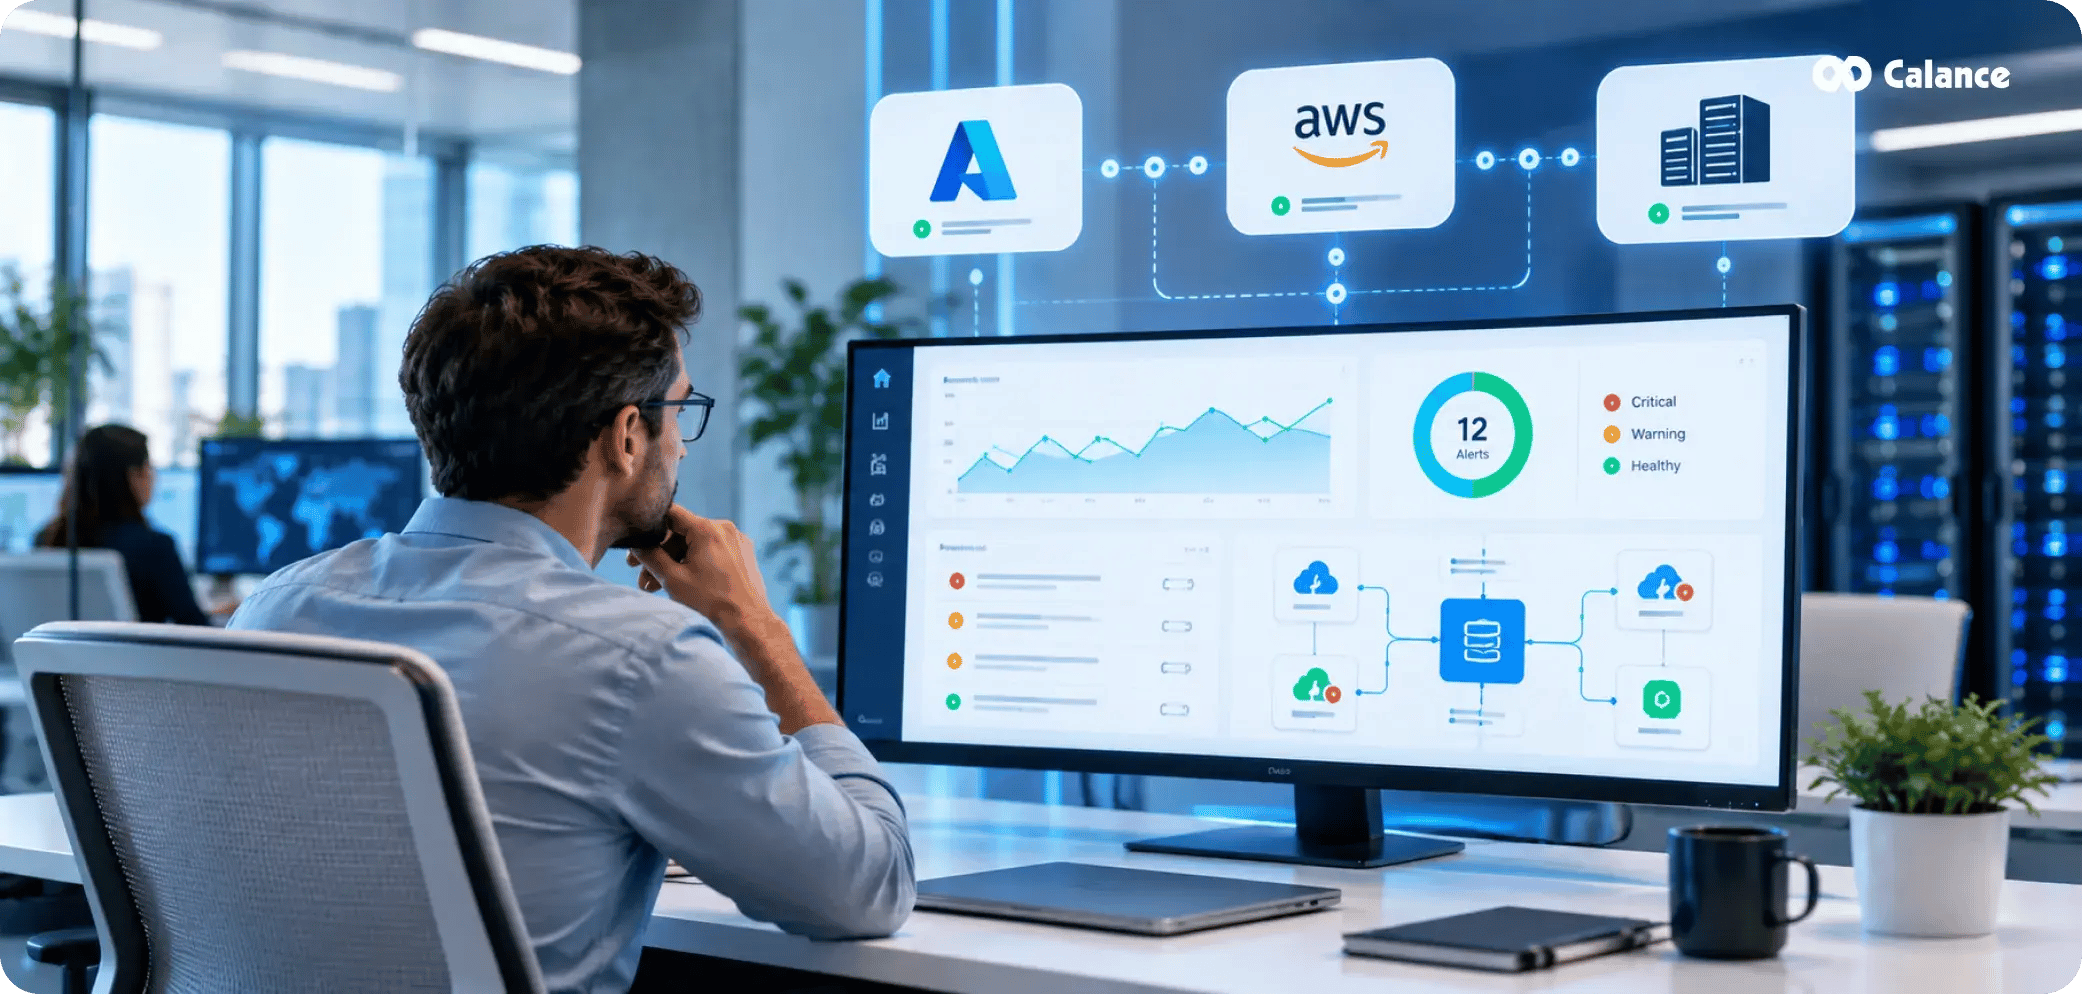
A unified dashboard is successful only when responders can trace a failing business service through its cloud and on-premises dependencies, identify ownership, and start the correct runbook. Test the workflow before treating the dashboard as production-ready.
| Acceptance check | Test method | Evidence to retain |
|---|---|---|
| Asset coverage | Reconcile cloud inventories and on-prem discovery against monitored assets | Missing-asset register with owners |
| Cross-platform context | Trigger a controlled alert from a service with dependencies in two environments | Linked telemetry and dependency view |
| Routing and escalation | Generate an agreed test incident outside business hours | Acknowledgment and escalation timestamps |
| Collection reliability | Disconnect or stop a test collector | Alert for stale or missing telemetry |
| Cost and retention | Compare forecast with actual ingestion and storage | Cost by source and retention class |
| Recovery evidence | Run an approved failover or diagnostic drill | Runbook steps, outcome, and follow-up work |
At Calance, we recommend reviewing this evidence with application owners and operations teams together. Infrastructure metrics alone do not establish business-service health. A clear operational handoff is just as important as choosing the collection platform.
The Same Example After Monitoring Is Integrated
Revisit the illustrative 2:47 a.m. scenario in an integrated design. The storage latency breach lands in the correlation layer tagged to its service and tier. At 2:53 the replica-lag signal arrives carrying the same service tag, and the platform groups them: one incident, probable cause upstream, severity inherited from the tier map. With correctly configured correlation and paging, the storage signal may reach the owning team before customer-facing errors increase. Whether this happens in practice depends on collection latency, dependencies, thresholds and responder coverage. The desired result is earlier diagnosis, not a guaranteed number of minutes saved.
How Calance Supports Unified Infrastructure Monitoring
The build in this article is real and achievable, and some teams should absolutely run it themselves. The part that rarely survives contact with reality is the watch: ninety days of engineering still ends with a pager, and pagers need people. At Calance, we help operate hybrid monitoring programs: unified telemetry across Azure, AWS, and on-premises, correlation tuned until pages mean something, and response workflows connected to a 24/7 monitoring function where contracted. We assess coverage, owner routing, incident records and recovery evidence rather than promising that every issue will be detected before a customer notices it.
Start with a visibility assessment: we map what you’re actually watching against what you actually own, and the gap between those two lists usually makes the rest of the conversation very short.
Frequently Asked Questions
1. What is unified infrastructure monitoring?
Unified infrastructure monitoring collects health, performance, and log telemetry from every environment an organization runs (public clouds like Azure and AWS plus on-premises servers and networks) into one correlated view with consistent alerting, dashboards, and response ownership.
2. What is a single pane of glass in monitoring?
A single pane of glass is one console showing the entire IT estate’s health across clouds and on-premises. In practice it’s an outcome you engineer (standardized telemetry, one correlation layer, owned dashboards) rather than a product you buy; purchased without that work, it becomes simply another pane.
3. Can Azure Monitor monitor AWS?
Partially. Through Azure Arc, AWS EC2 instances and on-premises servers can run the Azure Monitor Agent and report into Log Analytics like Azure VMs, and Microsoft publishes multicloud guidance for AWS log collection. AWS services such as RDS or Lambda require additional ingestion or integrations beyond Arc server onboarding.
4. Can CloudWatch monitor Azure?
Not automatically. CloudWatch does not natively discover and collect Azure platform telemetry in the way it collects AWS metrics. Teams can integrate Azure data through supported exporters, agents or partner tooling, but they must build and maintain the collection and correlation path.
5. Can CloudWatch monitor on-premises servers?
Yes. The CloudWatch agent installs on on-premises Windows and Linux servers and ships their metrics and logs into CloudWatch, where they behave like EC2 telemetry for dashboards and alarms.
6. What is Azure Arc?
Azure Arc is Microsoft’s hybrid management service that projects non-Azure resources (on-premises servers, VMware VMs, Kubernetes clusters, and servers in other clouds) into Azure as managed objects, so Azure Monitor, Policy, and Defender can govern them alongside native Azure resources.
7. What is the difference between monitoring and observability?
Monitoring checks known indicators against thresholds to confirm systems are healthy. Observability combines metrics, logs, and traces so engineers can investigate problems they never predicted. Monitoring answers whether it’s up; observability answers why it’s slow.
8. What is OpenTelemetry?
OpenTelemetry is the CNCF open standard for collecting metrics, logs, and traces through one set of APIs, SDKs, and collectors, exportable to any backend. Both Azure Monitor and CloudWatch accept OpenTelemetry data, and AWS now recommends it over the X-Ray SDK, which entered maintenance mode in February 2026.
9. What are the golden signals of monitoring?
Latency, traffic, errors, and saturation: the four measurements that describe almost any service’s health. For infrastructure, they translate into response time, load, failure rates, and resource headroom, and they’re the right starting set for per-tier alert thresholds.
10. What is the difference between MTTD and MTTR?
MTTD (mean time to detect) measures how long a fault exists before monitoring surfaces it; MTTR (mean time to restore) measures how long from detection to recovery. Unified monitoring primarily attacks MTTD and the diagnosis portion of MTTR.
11. Agent-based or agentless monitoring: which is better?
Both, deliberately. Agents provide deep OS, process, and log telemetry on servers; agentless methods (SNMP, WMI, API polling) cover network devices, appliances, and anything that can’t host an agent. Mature hybrid estates run agents on what matters and agentless everywhere else.
12. Why do organizations use more than one monitoring tool?
More than one view implies: LogicMonitor’s 2026 Observability and AI Outlook found Tool counts vary by survey and organization. The operational issue is whether telemetry, ownership and incidents can be correlated across the installed platforms.
13. What causes alert fatigue and how do you fix it?
Uncorrelated tools firing per-symptom alerts with default thresholds. Fix it with deduplication, grouping by service and time, suppression of downstream symptoms, an actionability rule for anything that pages, and a monthly review that fixes or kills the ten noisiest alerts.
14. What is AIOps in monitoring?
AIOps applies machine learning to operational telemetry: learning each metric’s normal baseline for anomaly detection, clustering alert storms into single probable causes, and flagging patterns that precede failures. It amplifies well-organized monitoring and cannot rescue poorly tagged, partial coverage.
15. Do we need 24/7 monitoring staff for hybrid infrastructure?
If outages at night cost money or compliance standing, yes, someone must acknowledge and act around the clock, and staffing requires multiple shifts, leave coverage and escalation capacity; the required number depends on the service model. Managed NOC and co-managed models exist because the watch, not the tooling, is usually the unaffordable part.
Let’s Build Your Digital Future Together
Tell us about your business challenges — we’ll help craft the right solutions.
Book a Free Consultation →